Marketplace apps
Installers — the side services deployed on your servers for infrastructure, monitoring, and developer tools.
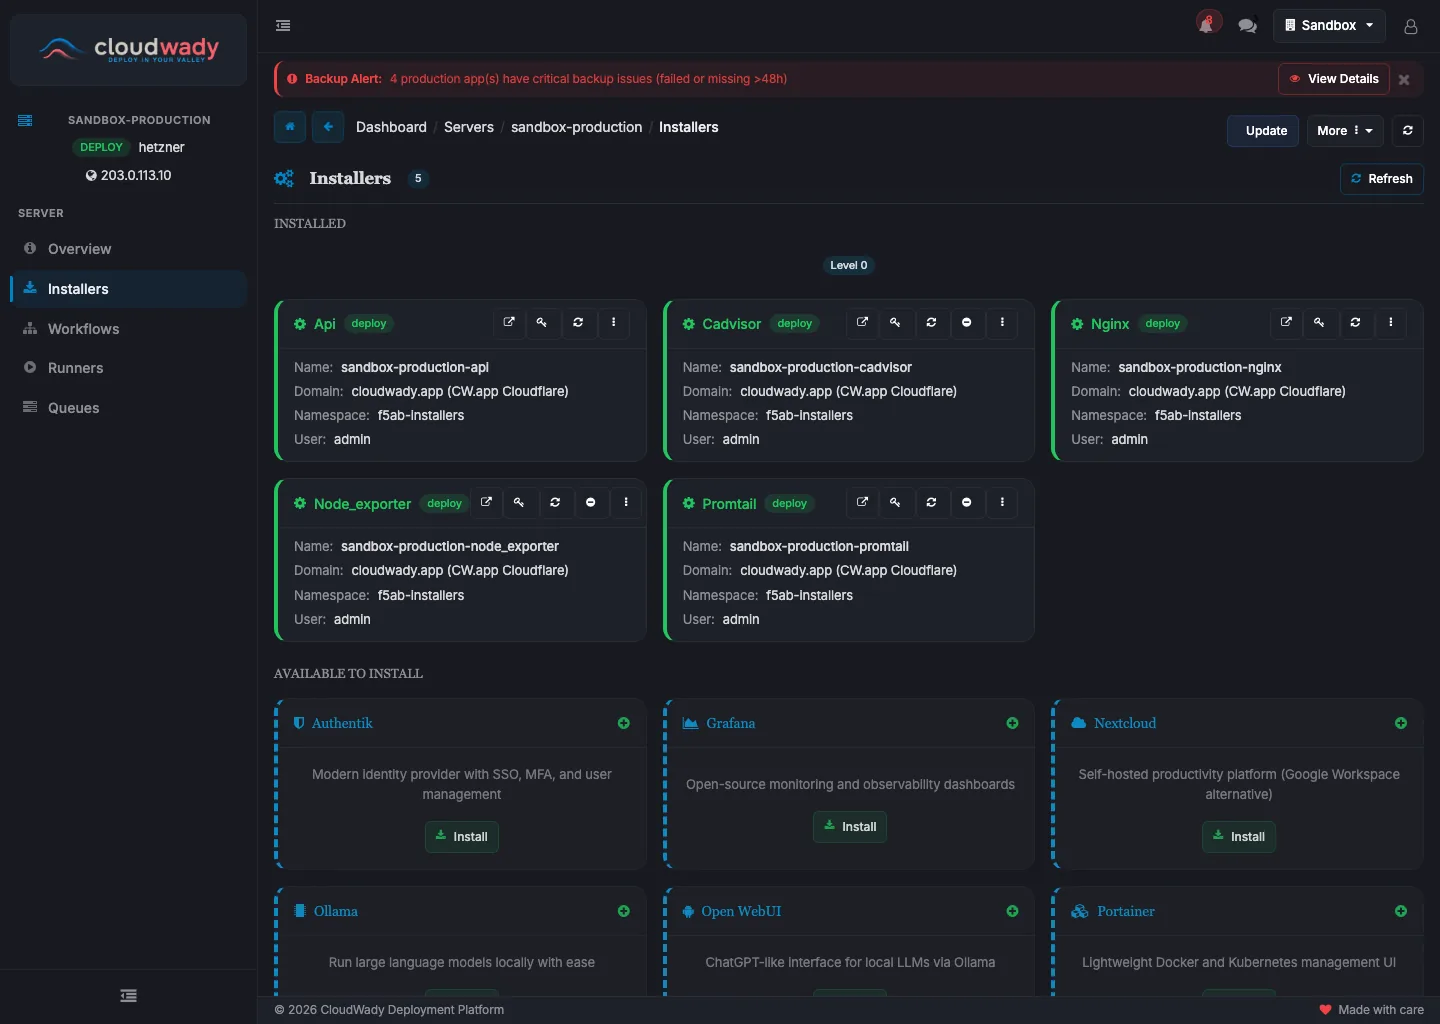
Installers
Installers are services deployed on your servers to provide infrastructure, monitoring, and developer tools. They are managed from the Installers menu in the server sidebar. Some are mandatory (auto-deployed on every server), while others are optional and can be deployed on demand.
Installer Sidebar
Each installer has its own detail screen with sidebar navigation:
| Menu Item | Icon | Description |
|---|---|---|
| Overview | fa-info-circle | Installer info with tabs: Overview (Core), URLs (Network) |
| Workflows | fa-sitemap | Installer workflow execution history |
| Variables | fa-cogs | Installer configuration variables (requires update permission) |
Available Actions
| Action | Description | Condition |
|---|---|---|
| Open | Launch the service URL in a new browser tab | Service URL available |
| Get Password | Copy the service password to clipboard | Service has a password |
| Deploy | Deploy the installer to the server | State is not deployed |
| Update | Update the deployed installer | State is deployed |
| Uninstall | Remove the deployed installer from the server | State is deployed, not a root type |
| Delete | Delete the installer record | State is not deployed |
Mandatory Services
These services are automatically deployed on every server and cannot be removed. They provide the core infrastructure that all other services depend on.
Nginx
Reverse proxy and web server. Routes incoming traffic to all deployed applications and installers on the server. Automatically configured whenever apps or services are deployed — handles SSL termination, load balancing, and URL routing.
API Services
Internal API layer for server communication. Handles health checks, metrics collection, and management commands between CloudWady and the server. Required for all server operations.
Monitoring & Metrics
These services collect and visualize server and application data. Node Exporter, Promtail, and cAdvisor feed metrics and logs back to CloudWady's monitoring dashboards.
Grafana
Monitoring dashboards for visualizing server and application metrics. Displays data collected by Prometheus in interactive charts — CPU usage, memory, disk I/O, network traffic, and more. Accessible via its own service URL on the server.
Prometheus
Metrics collection engine. Scrapes and stores time-series data from Node Exporter (host metrics) and cAdvisor (container metrics). Powers the Grafana dashboards with historical and real-time data.
Node Exporter
Host system metrics agent. Exports CPU, memory, disk, and network data to Prometheus. This data is displayed in CloudWady's System Monitoring dashboards, giving you visibility into server health without leaving the platform.
cAdvisor
Container metrics agent. Exports per-container resource usage (CPU, memory, network, filesystem) to Prometheus. CloudWady uses this data to show resource consumption per application in the monitoring dashboards.
Loki
Log aggregation system. Collects and indexes application logs for efficient querying and analysis via Grafana. Works together with Promtail to provide a complete logging pipeline.
Promtail
Log collector agent. Ships container and application logs to Loki for storage and indexing. CloudWady displays these logs in the Application Logs monitoring dashboard, enabling real-time log viewing with filtering by level, module, and time range.
Developer Tools
Web-based tools for database management, code editing, and file browsing. Deploy them on your servers and access via their service URLs.
pgAdmin
Web-based PostgreSQL administration tool. Provides a graphical interface for managing databases, running SQL queries, viewing table structures, and monitoring database performance. Once deployed, access it via the service URL with the generated credentials.
Coder (Code Server)
Cloud-based IDE accessible from the browser. Provides a full VS Code editing experience directly on the deployment server — edit code, run terminal commands, and manage files without needing SSH access. Useful for quick configuration changes and debugging.
Filestash
Web-based file manager for browsing and managing files on the server. Upload, download, edit, and organize files through a familiar explorer interface. Supports SFTP connections to storage boxes for backup file management.